Early Retirement Portfolio Income Update, November 2015

monopoly_divI like the idea of living off dividend and interest income. Who doesn’t? The problem is that you can’t just buy stocks with the highest dividend yields and junk bonds with the highest interest rates without giving up something in return. There are many bad investments lurking out there for desperate retirees looking only at income. My goal is to generate reliable portfolio income by not reaching too far for yield.

A quick and dirty way to see how much income (dividends and interest) your portfolio is generating is to take the “TTM Yield” or “12 Mo. Yield” from Morningstar quote pages. Trailing 12 Month Yield is the sum of a fund’s total trailing 12-month interest and dividend payments divided by the last month’s ending share price (NAV) plus any capital gains distributed over the same period. SEC yield is another alternative, but I like TTM because it is based on actual distributions (SEC vs. TTM yield article).

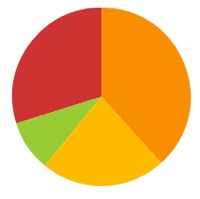
Below is a close approximation of my most recent portfolio update. I have changed my asset allocation slightly to 60% stocks and 40% bonds because I believe that will be my permanent allocation upon early retirement.

Asset Class / Fund % of Portfolio Trailing 12-Month Yield (Taken 11/5/15) Yield Contribution
US Total Stock
Vanguard Total Stock Market Fund (VTI, VTSAX)
24% 1.92% 0.46%
US Small Value
WisdomTree SmallCap Dividend ETF (DES)
3% 2.98% 0.09%
International Total Stock
Vanguard Total International Stock Market Fund (VXUS, VTIAX)
24% 2.83% 0.66%
Emerging Markets Small Value
WisdomTree Emerging Markets SmallCap Dividend ETF (DGS)
3% 3.44% 0.10%
US Real Estate
Vanguard REIT Index Fund (VNQ, VGSLX)
6% 3.92% 0.24%
Intermediate-Term High Quality Bonds
Vanguard Intermediate-Term Tax-Exempt Fund (VWIUX)
20% 2.99% 0.60%
Inflation-Linked Treasury Bonds
Vanguard Inflation-Protected Securities Fund (VAIPX)
20% 1.31% 0.26%
Totals 100% 2.41%


The total weighted 12-month yield was 2.41%. This means that if I had a $1,000,000 portfolio balance today, it would have generated $24,100 in interest and dividends over the last 12 months. Now, that is significantly lower than the 4% withdrawal rate often quoted for 65-year-old retirees with 30-year spending horizons, and is even lower than the 3% withdrawal rate that I have previously used as a rough benchmark. I’ll note that the muni bond interest in my portfolio is exempt from federal income taxes.

Given the volatility of stock returns, the associated sequence of returns risk, and current high valuations, I still like the income yield measuring stick. I feel that the income yield number does a rough job of compensating for stock market valuations (valuations go up, probably dividend yield go down) as well as interest rates (low interest rates now, probably low bond returns in future). With 60% stocks, I am hoping that the dividends will at least keep up with inflation, and that I will never have to “touch the principal”. Over the last 15 years or so, the annual growth rate of the S&P 500 dividend averaged about 5%.

As noted previously, a simple benchmark for this portfolio is Vanguard LifeStrategy Moderate Growth Fund (VSMGX) which is an all-in-one fund that is also 60% stocks and 40% bonds. That fund has a trailing 12-month yield of 2.07%. Taken 11/9/2015.

So how am I doing? Staying invested throughout the last 10 years has been good to me. Using the 2.24% income yield, the combination of ongoing savings and recent market gains have us at 84% of the way to matching our annual household spending target. Consider that if all your portfolio did was keep up with inflation each year (0% real returns), you could still spend 2% a year for 50 years. From that perspective, a 2% spending rate seems like a very conservative number. As such, we are currently redirecting a chunk of our monthly savings into a college savings account. We are doing well and we want to help pay for our children’s higher education, so might as well get that tax-deferral started now.

Early Retirement Portfolio Asset Allocation Update, November 2015

Here’s a (late) Q3 2015 update on my investment portfolio holdings for 2015. This includes tax-deferred accounts like 401(k)s and taxable brokerage holdings, but excludes things like real estate and cash reserves (emergency fund). The purpose of this portfolio is to create enough income to cover household expenses.

Target Asset Allocation

aa_updated2015

I try to pick asset classes that will provide long-term returns above inflation, distribute income via dividends and interest, and finally offer some historical tendencies to balance each other out. I don’t hold commodities futures or gold as they don’t provide any income and I don’t believe they’ll outpace inflation significantly. In addition, I have doubt that I would hold them through an extended period of underperformance (i.e. don’t buy what you don’t can’t stick with).

Our current target ratio is 70% stocks and 30% bonds within our investment strategy of buy, hold, and rebalance. With a self-directed portfolio of low-cost funds and low turnover, we minimize management fees, commissions, and taxes.

Actual Asset Allocation and Holdings

1510_port_aa

Stock Holdings
Vanguard Total Stock Market Fund (VTI, VTSMX, VTSAX)
Vanguard Total International Stock Market Fund (VXUS, VGTSX, VTIAX)
WisdomTree SmallCap Dividend ETF (DES)
WisdomTree Emerging Markets SmallCap Dividend ETF (DGS)
Vanguard REIT Index Fund (VNQ, VGSIX, VGSLX)

Bond Holdings
Vanguard Limited-Term Tax-Exempt Fund (VMLTX, VMLUX)
Vanguard Intermediate-Term Tax-Exempt Fund (VWITX, VWIUX)
Vanguard High-Yield Tax-Exempt Fund (VWAHX, VWALX)
Vanguard Inflation-Protected Securities Fund (VIPSX, VAIPX)
iShares Barclays TIPS Bond ETF (TIP)
Individual TIPS securities
U.S. Savings Bonds (Series I)

What’s New? Commentary
Things are still sticking pretty close to my target asset allocation. Before the year ends, I would like to relocate my “spice it up” holdings of WisdomTree SmallCap Dividend ETF (DES) and WisdomTree Emerging Markets SmallCap Dividend ETF (DGS). Mostly because a big chunk of their dividends are unqualified and thus subject to higher income rates. I can also do a bit of tax loss harvesting. But where to move them? I could squeeze them in my Fidelity Solo 401k plan that lets me buy ETFs (displacing either TIPS or REITs), buy similar mutual funds in my Schwab 401k brokerage window (displacing TIPS), or even buy some similar DFA funds in a Utah 529 account and consider it part of my portfolio (smart?). Or I could just liquidate them and just stick with total stocks funds (boring).

As for bonds, I’m still underweight in TIPS mostly due to lack of tax-deferred space as I really don’t want to hold them in a taxable account. My taxable bonds are split roughly evenly between the three Vanguard muni funds. The average duration across all of them is roughly 4-5 years.

A simple benchmark for my portfolio is 50% Vanguard LifeStrategy Growth Fund (VASGX) and Vanguard LifeStrategy Moderate Growth Fund (VSMGX), one is 60/40 and one is 80/20 so it also works out to 70% stocks and 30% bonds. That benchmark would have returned about 1.47% YTD for 2015 (as of 11/4/15). I haven’t bothered to calculate my exact portfolio return, but it should be close to this number.

I like tracking my dividend and interest income more than overall market movements. In a separate post, I will update the amount of income that I am deriving from this portfolio along with how that compares to my expenses.

myRA Starter Retirement Account Launches Nationwide

myra_logoThe U.S. Department of the Treasury announced the national launch of myRA (my Retirement Account), a new starter option for those who don’t have access to a retirement savings plan at work. There have been some improvements and tweaks since their initial pilot launch in late 2014.

No monthly or annual fees. No minimum contribution requirement. No minimum balance requirement. Contribute as little as a dollar every paycheck if you like.

Fund via automatic paycheck deduction, automatic bank transfers, or federal tax refund. Automatic paycheck deductions work through your employer’s direct deposit system.

myra_calc

No risk of loss. Your money is backed by the US government, just like US Treasury bonds and FDIC-insured bank accounts. You earn the same interest rate as the Government Securities fund available to Federal employees, known as the G Fund. The good news is that it earns the higher interest of longer-maturity bonds while maintaining zero principal risk like a bank account. Interest is compounded daily.

The G Fund 1-year historical return for 2014 was 2.31%. Taken from TSPFolio, here is the interest rate history. The current annualized rate for November 2015 is 2.125%.

myra_grate

What does “starter account” mean? There are no stocks or other riskier options here. You can roll over your myRA into a private-sector Roth IRA once you’ve either reached the max balance of $15,000 or the max time period of 30 years.

What do you mean it’s a Roth IRA? I mean just that; it is a Roth IRA. The same rules apply:

  • Tax-fee and penalty-free withdrawal of contributions at any time, if needed.
  • If you make a qualified withdrawal, you’ll pay no taxes on both contributions and earnings.
  • For 2015, the contribution limit per person is $5,500 a year, or $6,500 if you are at least 50 years old by the end of the year.
  • The income limit is based on modified adjusted gross income (MAGI). The 2015 phase-out range for singles is $116,000 to $131,000. For married filing jointly is $183,000 to $193,000.

Although you may not be the target audience, you can still use myRA if you have a 401k or previous IRAs. Again, myRA is a Roth IRA so you’d have to direct part or all of your annual contribution to this Roth IRA instead. The G Fund is something that I would invest in if it was an option for me, but it is somewhat inconvenient to open another account just for one investment option. For example, if you are 90% stocks and 10% bonds, a $5,000 total contribution would only direct $500 towards a myRA.

Commentary. As I noted when it first came out, myRA is kind of a Frankenstein cobbled together from the parts bin. Existing Roth IRA vehicle. Existing Thrift Savings Plan G Fund. Comerica Bank quietly manages the backend (they’ve done previous work for the Treasury). It’s a bit clunky as you have to tell your employer to direct deposit some of your paycheck into your myRA, which a is basically a Comerica bank savings account and routing number (111925074). If you employer can’t handle split direct deposits, you must contribute via bank transfer or tax refund.

Will this combo convince someone who’s not saving today, to start? My guess is that the popularity will be relatively low. While I personally wouldn’t mind having the G Fund as an investment option, but I don’t know that someone who’s not saving now will be enticed by a 2% interest rate. (Maybe if rates rise.) But hopefully I’m wrong and the opportunity to have a “retirement plan of your own” is enough.

To me, what’s missing is super-easy auto-enrollment (auto opt-in, voluntary opt-out). So the best case scenario is if small businesses without 401(k) plans actively encourage their employees to sign up for myRA, as we’ve seen that automatic deductions are a good trick to save more for retirement. For more information, visit the myRA.gov employer FAQ.

Morningstar Top 529 College Savings Plan Rankings 2015

morn_logo

Investment research firm Morningstar has released their annual 529 College Savings Plans Research Paper and Industry Survey. While the full survey appears restricted to paid premium members, they did release their top-rated plans for 2015. Remember to first consider your state-specific tax benefits that may outweigh other factors. If you don’t have anything compelling available, you can open a 529 plan from any state.

Here are the Gold-rated plans for 2015 (no particular order). Morningstar uses a Gold, Silver, or Bronze rating scale for the top plans and Neutral or Negative for the rest.

Here are the consistently top-rated plans from 2010-2015. This means they were rated either Gold or Silver (or equivalent) for every year the rankings were done from 2010 through 2015.

  • T. Rowe Price College Savings Plan, Alaska
  • Maryland College Investment Plan
  • Vanguard 529 College Savings Plan, Nevada
  • CollegeAdvantage 529 Savings Plan, Ohio
  • CollegeAmerica Plan, Virginia (Advisor-sold)

The trend here is consistency. There was no change in either of the lists above as compared to last year. Utah only missed on out the consistent list because they weren’t top-ranked in 2010.

The “Five P” criteria.

  • People. Who’s behind the plans? Who are the investment consultants picking the underlying investments? Who are the mutual fund managers?
  • Process. Are the asset-allocation glide paths and funds chosen for the age-based options based on solid research? Whether active or passive, how is it implemented?
  • Parent. How is the quality of the program manager (often an asset-management company or board of trustees which has a main role in the investment choices and pricing)? Also refers to state officials and their policies.
  • Performance. Has the plan delivered strong risk-adjusted performance, both during the recent volatility and in the long-term? Is it judged likely to continue?
  • Price. Includes factors like asset-weighted expense ratios and in-state tax benefits.

A broad recommendation is to simply stick with one of the plans listed above unless your in-state plan is offering significant tax breaks. Many other state plans may have specific investments that will work just fine as well. Here are my personal favorites, and why:

  • The Nevada 529 Plan for its low costs, variety of Vanguard investment options, and long-term commitment to consistently lowering costs as their assets grow. The Vanguard co-branding is also a sign of positive stewardship.
  • The Utah 529 plan has low costs, includes a nice selection of Vanguard and DFA funds, and is highly customizable for DIY investors. Over the last few years, the Utah plan has also shown a history of passing on future cost savings to clients.

I feel that a trend of consumer-first practices is important as the quality of all 529 plans can change with time. Sure, you can roll over your funds elsewhere, but wouldn’t you rather have your current plan just keep getting better and better?

William Bernstein: Picking The Right Bonds For Your Portfolio

pie_flat_blank_200Author and investment advisor William Bernstein wrote a thoughtful WSJ piece on bonds, which I think is useful for the DIY investor. The overall theme is that you should take minimal risks with the bonds in your portfolio. Taken in isolation, some types of bonds are likely to provide higher long-term returns than others. However, you should consider how they fit into your entire portfolio. Historically, it has been more efficient to take your risk with stocks and use your bonds for their stability. Bonds become the “dry powder” you can use to buy more stocks after a crash (rebalance!).

I found myself breaking down the article into three main categories. The types of bonds he recommends most, the ones he considers acceptable, and the rest which should be avoided. These are my short notes; read the article for the supporting arguments.

PREFER

  • Individual US Treasury bonds, manually laddered.
  • US Treasury bond mutual funds, for smaller balances.
  • Top-yielding FDIC-Insured Certificates of Deposit, manually laddered.
  • Short-term or intermediate-term, higher-quality municipal-bond funds, for large taxable balances.

OKAY

  • “Total bond index” mutual funds, as they consist mainly of high-grade, government-backed bonds.
  • US Treasury bond mutual funds for larger balances.

AVOID

  • All corporate bonds, but especially avoid lower-grade and/or longer-term corporate bonds.
  • Lower-grade and/or longer-term municipal bonds.

I would point out that inflation-protected bonds (TIPs) are not mentioned directly, I guess because they aren’t directly comparable to these nominal bonds. Either that, or he just considered them to be the same as traditional Treasuries. He talks about TIPs a lot elsewhere (including his books), so a little specific advice would have been helpful.

My other opinion is that running your own bond ladder is quite doable but only the most DIY of DIY investors would do it better than a low-cost bond fund. I own individual TIPS and it’s not hard but not a ton of fun either to keep track of auction dates and avoid cash drag. Vanguard charges only 0.12% annually for their short-term government bond ETF (VGSH) and Admiral fund equivalent. $12 a year per $10,000. $120 a year for $100,000. I’d rather just pay that unless I had millions or I had a lot more free time. However, if you’re already paying a financial advisor, I would let them manage an individual bond ladder as part of their fee.

Owning a McDonald’s Franchise: Purchase Cost vs. Annual Profit

mcfranchise_logoDespite their negative media attention, the McDonald’s franchise that I drive past every day is packed all the time. I rarely eat there (especially since my diet bet), but I used to think to myself that if I were going to buy a franchise, I’d buy a McDonald’s. My impression was always that McDonald’s were always pretty clean with consistent food (even if you consider it consistently unhealthy), while Burger King’s were often dirty with inconsistent food.

A common knock against purchasing a franchise is that you are “buying a job”. A recent Businessweek article broke down the gross sales, gross profits, and net profits of the average McDonald’s franchise in the US. I found the numbers very interesting:

mcfranchise_income

Average annual profit per franchise: $150,000 a year, roughly. Okay, but how much does this franchise cost? From the official McDonald’s franchise website:

Initial Costs
$45,000 Initial Fee paid to McDonald’s

Equipment and Pre-Opening Costs
Typically these costs range from $944,352 to $2,172,045. The size of the restaurant facility, area of the country, pre-opening expenses, inventory, selection of kitchen equipment, signage, and style of decor and landscaping will affect new restaurant costs. These costs are paid to suppliers.

Average cost of new franchise: At least $1 million roughly, with a minimum of $500,000 in cash and non-borrowed resources. Other sources state $750,000 minimum in liquid assets. You must be able to cover 40% of the costs of a new franchise location. You must be able to pay cash for at least 25% of the cost of an existing franchise, with the rest financed over at most 7 years.

Average hours of work per week as an owner/operator? I could not find reliable statistics, but here is an excerpt from a Reddit AMA from a businessperson from New Zealand who has owned a total of three McDonald’s franchises and recently sold the last one.

How much work was required of you per week on average? If my goal were to own one McDonalds and do the minimum amount of work possible, while also running it well, how low do you think I could get that weekly number of hours? And what would I be doing in that time?

I would work 9am – 5pm, 6 days a week. Mostly I’m at my office sorting problems remotely from there. I liked to pop down to my couple stores at least a couple times a day and check on them – make sure they’re clean, and to check on the Restaurant Manager about any issues. Typically I used to work hard for 4-6 hours a day, with the rest out in the stores just checking on them.

Exit / Selling price? One would imagine that if your franchise is doing well and churning out good numbers, someone else would readily buy it. If your business is struggling, then both your annual income and total business value will drop. The same Reddit user above reported selling for “just above” NZ $1.4 million, or US $916,000. I’m a bit confused by the purchase price, but it appears that he paid NZ $550,000 via business loan, 12 years ago.

In the end, owning a McDonald’s franchise is still a business which means you take on risk for potentially significant gains or losses. But if you spend 40 hours a week and only keep tabs on one location, it might really feel like you bought a job. These statistics help explain why most franchisees own multiple locations; Businessweek says the average is six.

Ideal Diversification Between US and International Stocks?

earth_apolloOne of the decisions a DIY investor needs to make is how much international stock exposure to add to their portfolio. Recently, the US stock market has had much higher returns than non-US stocks overall, including Emerging Markets. But this Vanguard article reminds us of the diversification benefits of adding international stocks. Somewhere between 20% and 50% is the historical sweet spot:

vg_intl

Vanguard says 60/40 is best. Over the past year or so, Vanguard has shifted their “ideal” stock asset allocation to 60% US and 40% international. This is the breakdown used for their Target Retirement 20XX funds, their LifeStrategy funds, and also their 529 College Savings Age-Based portfolios. Part of their justification is that the expense ratios for their international funds has dropped as well.

World market cap weighting is at 52/48. What do the global capital markets have to say? The world market cap weighting has shifted to 52% US and 48% non-US, as tracked by the Vanguard Total World Stock ETF (VT). VT tracks the FTSE Global All Cap Index which is a free-float-adjusted, market-capitalization-weighted index.

I like simplicity and symmetry, so I am sticking with 50/50. I’m just one amateur, but I feel the trend is towards a market-cap weighting. 50/50 isn’t all that far from 60/40, especially because my overall asset allocation will soon by 60% stocks and 40% bonds. 50/50 is also really easy to rebalance and makes my portfolio looks nice and symmetrical.

Want some support to own international stocks? If the recent poor performance of international stocks has you down, Research Affiliates recently updated their Expected Returns Chart (mentioned previously) and it shows Developed European, Developed Asian, and Emerging Market stocks having a much better outlook than US stocks:

vg_intl2

They use a mix of different historical valuation techniques to make these forecasts, so they aren’t just pulled out of thin air.

Want some support to NOT own international stocks?
While it is hard to argue against the historical diversification benefit of owning some international stocks, I don’t know if it is absolutely necessary. If you bought big chunk of the S&P 500, and a smaller chunk of US Treasuries, and ignored it for 30-40 years, you’d probably come out pretty happy. Some big names would agree:

One argument is that many US companies already make a huge chunk of their money from their international operations anyway.

So there you have it. I hope you are sufficiently confused. 🙂

Simple Portfolio Rebalancing: Year-End vs. Random Day

I’m catching up on some reading. James Picerno of The Capital Spectator did some backtesting of simple portfolio rebalancing where once a year you go back to your target asset allocation. Does it matter if you rebalance at the end of every year, or just pick any random date once a year? His test portfolio was a globally diversified portfolio made up 60% stocks and 40% bonds (11 different funds).

Here’s a chart of his results:

rebalance1510

His comments:

The basic message: rebalancing is a valuable tool for generating superior risk-adjusted performance. But it seems that tapping into this value-added service doesn’t require a lot of intellectual firepower for a standard asset allocation strategy. Letting a monkey choose the rebalancing dates over a period of years works as well if not better than automatically rebalancing at the end of each year.

My version: Rebalancing helps you maintain your desired risk profile, and it may even improve your risk-adjusted returns (it did in the last decade). Get the benefit with minimal fuss by rebalancing once a year. It doesn’t really matter what day, just make sure to do it once a year. However, I find it easier to stick with the same one every year so you can put it on your calendar. (First business day after Christmas, July 1st, your birthday, etc.)

Finametrica Risk Tolerance Assessment Review + Discounts

riskprofile0Spend any time researching investments, you’ll eventually run across the concept of “risk tolerance”. If you don’t hold an investment through both the ups and downs, then you won’t enjoy its average returns, either. So how can you predict your behavior ahead of time?

What the financial industry uses is a risk tolerance survey, or risk questionnaire. You are asked a series of multiple choice questions based on theoretical scenarios to find your risk tolerance. You or a hired professional can then use that information – along with other factors like risk required and risk capacity – to determine your portfolio. I’ve taken several of these online assessments, but can someone really know how they would react to a 50% drop in their net worth in an environment of mass panic, without actually experiencing it? It is the real-world behavior that matters.

If a risk survey is the best tool available, what is the best risk survey? Which one is most carefully-written, backed by academic research, and historically vetted? From what I can tell, that is the Finametrica Risk Profiling Survey. Normally the cost is $40 for an individual to take the test, but I ran across a discount in this CNN Money article:

You can get a more accurate gauge of your appetite for risk by completing a risk tolerance questionnaire. Vanguard has a good asset allocation tool that’s free, while FinaMetrica offers a more comprehensive version for $40 (although given recent market turbulence FinaMetrica is offering the test and the nine-page report that comes with it for $4 until the end of September). Both tests recommend an investment portfolio based on your answers.

Okay, four bucks, I can handle that. (The promo has been extended to October 31st, as well.) I paid, answered 25 multiple choice questions, and I was done in under 10 minutes. Of course, a few more minutes of poking around and I discovered the same test for free by clicking here. Pfft. What’s up with that?

(Update: Reader Jason points out that the free version doesn’t accept free e-mails like “gmail.com”. I would suggest trying various free e-mail forwarding services if you want a workaround. Just google “disposable e-mail”.)

Questions. I took screenshots of the entire survey but I won’t post the specific questions here. They do share these sample questions, which I can confirm are actual questions from the paid test.

1. Compared to others, how do you rate your willingness to take financial risks?
Extremely low risk taker.
Very low risk taker.
Low risk taker.
Average risk taker.
High risk taker.
Very high risk taker.
Extremely high risk taker.

2. How easily do you adapt when things go wrong financially?
Very uneasily.
Somewhat uneasily.
Somewhat easily.
Very easily.

3. When you think of the word “risk” in a financial context, which of the following words comes to mind first?
Danger.
Uncertainty.
Opportunity.
Thrill.

The general idea is that the questions poke and prod you from various directions, trying to avoid having one misunderstood question alter your overall results. The questions were all brief and multiple choice, except for the last one which asked you to predict your own risk tolerance score relative to the overall population.

Results. Well, I guessed that my score would be 50 out of 100. My actual score was 54 out of 100, which they say is “slightly-higher-than-average” and actually in the 64th percentile. (So the score isn’t a percentile even though they are on a bell curve? I’m not good at statistics.)

riskprofile1

According to your risk, you are assigned one of 7 Risk Groups. You are then told the “typical attitudes and values” for people of your Risk Group, as well as if you differed significantly in any specific areas. Here’s how people in my Risk Group 4 would have picked their overall portfolio:

riskprofile3

So my risk tolerance peers would pick Portfolio 4, but in reality I am between a Portfolio 5 and 6.

Finally, you are provided a summary chart. Here’s mine:

riskprofile2

Final impressions.

  • Relatively good risk tolerance survey. I’ve already expressed my view that these surveys are only one limited piece of the puzzle. But as far as risk surveys go, this one did feel like it went more in-depth than others that I have tried. However, I would have enjoyed more interactivity and/or questions using charts and/or graphs.
  • Best as a tool to help communicate your personality to others, like spouse or financial advisor. I didn’t feel the report was very useful to me. I already know that I am a relatively conservative investor who also knows that I have to take some risks to beat inflation. The real value of this survey is that it would help describe my investment personality to my spouse, partner, kids, or financial planner. So if it’s just you, I don’t know if I can recommend it. If you want to educate a family member, then it may be worth the time and money. If you have an advisor, get them to pay for it. 🙂
  • $40 price point is high for individuals. As a DIY investor, I would not have paid $40 to answer 25 multiple choice questions about myself. I can definitely see an advisor paying that much on behalf of their client as part of their service (and many do). At the discounted $4 rate, I thought it was worth it. Of course, free would have been even better…
  • Don’t expect any specific portfolio recommendations. The CNN article promised a “recommended investment portfolio based on your answers”. I don’t think that is an accurate statement (see table above). I would say you just get a very high-level breakdown of what other people of a similar risk level “would prefer”. They don’t even use the words “stocks”, “bonds”, or “cash”.

BullionDirect Bankruptcy: Buyer Beware With Gold Storage Companies

2015goldBullionDirect.com sold gold and silver bullion and even offered to store it in a vault for you for free. How nice of them. Unfortunately, they lied. From a Austin American-Statesman article with lots of customer interviews:

By the time auditors and lawyers got access to Bullion Direct’s 14th-floor offices six weeks ago, there were only a handful of gold and silver coins in an office safe. A second vault it had recently rented held only slightly more.

An estimated $30 million in cash, metal bullion and valuable coins, meanwhile, had vanished.

Here’s another snippet from a CoinWeek article (more detailed updates here):

Bullion Direct filed a declaration that stated that “when a customer placed an order, the precious metal was not actually purchased unless the customer agreed to take actual delivery of the product.” In other words, they never bought the metal customers purchased if it was to be stored.

This story is not about whether or not to buy gold. The lesson is that if you buy physical gold from a dealer and they either never deliver it to you or they say they’ll store it for you but the vault is really empty and say “oops we’re bankrupt!”… there is no government insurance mechanism that guarantees your assets. They can say they have “layers of insurance” and “regular, independent audits”, but they could also be lying to your face. If you have your gold stored somewhere, do you know the actual name of the insurance company they are using, and have you verified with that company about what exactly that policy covers?

From what I can tell, you could just replace “gold storage” with “pink teddy bear storage” to get an approximate idea of your level of protection. You can sue for your lost teddy bears, but if the company is broke and criminally stole your money, you may not get much if anything back even after liquidating any remaining assets.

This is very different from keeping assets under set limits at an FDIC-insured bank or holding regulated securities at an SIPC-insured brokerage firm. If you hold cash at a FDIC-insured bank and it fails, you’ll get your money back (subject to limits of $250k per account designation). If you hold Vanguard mutual funds in a TD Ameritrade account, those shares are also structured as to be protected if either Vanguard or TD Ameritrade has financial problems. (To be clear, your number of shares is protected up to limits, but the market value of those shares is not guaranteed.)

If I was to buy gold, so far my plan would be to buy 1 oz. American Eagle coins direct from a US Mint Authorized Purchaser, and then test them again myself with this Fisch gold coin tester. There is a premium over spot price for coins, but it would improve liquidity. Perhaps it is even worth paying the 3% markup for paying with credit card, especially if you can earn at least 2% in cash back or points, and then chalk up the net 1% markup as a form of purchase protection. Of course, storing it yourself has its own set of potential issues.

Charts: Municipal Bond to US Treasury Yield Ratio

I’ve been investing in tax-exempt municipal bonds for a few years now. I made the change due to a combination of reasons. For one thing, I started running out of room in my tax-deferred accounts for US Treasury bonds, TIPS bonds, and REITs. Second, I believe that buying muni bonds through a Vanguard actively-managed mutual fund gives me a diversified mix of high-quality bonds. Third, the effective after-tax yields on muni bonds can be very attractive when compared to US Treasury bond yields. In many time periods, muni yields have been as high as Treasury yields, even before any tax considerations. This was very rare pre-2008 financial crisis, with the historical average being a 80% ratio.

Here are a few charts that track the relationship between the yields on US Treasury and Investment-grade municipal bonds. Notice that the ratio of Muni-to-Treasury has kept close to 100% in the last few years. I’ve tried to dig up enough to cover a continuous timeline, but let me know if you have a better graph.

muni_timing3

Source: Wealthmanagement.com

muni_treasury_ratio

Source: Financial-Planning.com

muni_timing2

Source: ValueWalk.com

Although it can be tempting to use these charts as timing tools, I try to focus on the overall picture. Due to the tax-exempt advantage, I am happy as long as the muni rates are roughly the same as Treasury rates.

As of September 9, 2015, the SEC yield of Vanguard Intermediate-Term Tax-Exempt Investors Shares (VWITX) was 1.78% while the SEC yield of Vanguard Intermediate-Term Treasury Investor Shares (VFITX) was 1.43%. Both are hardly exciting and the muni fund is considered a little more risky (how much riskier is quite difficult to quantify), but for my own portfolio I think the higher yield is worth it especially considering the muni interest is exempt from federal income taxes.

Muni bonds are a somewhat different from other asset classes because they are owned mostly by individuals as opposed to institutions. Based on Morningstar investor returns, us individuals haven’t shown any superior skill at market timing their buys.

muni_timing

However, the performance gap is similar to that of the Vanguard Treasury fund of similar duration. So perhaps that gap is just due to the effect of natural cashflow timing (i.e. regular investments over time) rather than failed attempts at chasing performance.

Do Financial Advisors Really Keep Portfolios and Clients Disciplined?

I written about Dimensional Fund Advisors (DFA), a mutual fund family that is powered by top academic research. Another things that makes DFA unique is that they are only sold through approved financial advisors. You can’t buy them with just any old brokerage account. (Exceptions are certain 401(k)-style retirement plans and 529 college savings plans.) Allan Roth has new article about DFA funds in Financial Planning magazine, which is a trade publication targeted to financial professionals.

Why not sell directly to Average Joe investor? Here is David Butler, head of DFA Global Financial Advisor Services:

DFA has no intention of bypassing the advisor channel and offering its funds directly to retail investors. “We think advisors help keep investors disciplined,” Butler says.

In my previous post The True Value of a Real, Human Financial Advisor, I wrote about this concept. A good client advisor will help you keep your cool when the next disaster comes. Vanguard says that the biggest “value add” from good advisors is their “behavioral coaching”. A good financial advisor keeps you from making the “Big Mistake” that derails your plans.

onepage_bigmistake

But later in the same Allan Roth article, the idea of advisors as disciplinarians is called into question.

But do investors get better returns? I tested Butler’s claim that DFA advisors help keep investors disciplined by asking Morningstar to compare the performance gap between the two fund families. The performance gap is the difference between investor returns (dollar weighted) and fund returns (geometric).

Over the 10 years ending Dec. 31, 2014, the DFA annualized performance gap stood at 1.28% versus only 0.22% for Vanguard. When I showed these figures to Butler, he responded, “It’s hard to make an argument about the discipline of advisors based on these figures.

Here’s a primer on investor returns vs. fund returns. Investor returns are the actual returns earned by investors, based on the timing of their buying and selling activities.

The next step was to compare the investor returns of DFA’s largest fund, DFA Emerging Markets Value I Fund (DFEVX) with $14B in assets with the closest Vanguard competitor, Vanguard Emerging Markets Index Fund (VEMAX) with $54B in assets. I personally think a better comparison would be with their DFA Emerging Markets Core Equity I Fund (DFCEX), so I’m throwing that in as well.

DFA fund returns are often higher relative to index fund competitors. Here’s a Morningstar chart comparing the growth of $10,000 invested 10 years ago in each of the three funds. You can see the DFA funds do slightly better in terms of fund returns. Click to enlarge.

dfa_em_vg_10k

But what about investor returns? I took some screenshots of their respective Morningstar Investor Return pages.

dfa_em1b

dfa_em_vg

dfa_em3

We see that after accounting for the timing of actual cashflows, the average investor in the DFA fund actually lost money with an annualized return of -1.01% and -2.04%! Meanwhile, the average Vanguard investor earned over 6% annualized.

The three mutual funds don’t have the exact same investment objective, but they do both all pull from the overall Emerging Markets asset class. The DFA funds try to focus ways to earn greater long-term return by holding stocks with a higher “value” factor, but it also has a higher expense ratio. The Vanguard fund just tries to “buy the haystack” and passively track the entire index.

Let’s recap. The stated reason why DFA is only sold through advisors is that they offer more discipline. We are told that such behavioral coaching is where human advisors provide their greatest value. However, the evidence available suggests that DFA advisors are less good at trading discipline than when a similar fund is completely open to retail investors.

I found this rather surprising. I used to think that restricting my potential advisors to those were affiliated with DFA was one way of getting an “above-average” advisor. But after doing my own research, I found that even though DFA investments are generally lower-cost, the additional fees charged by individual advisors ranged widely from reasonable to quite expensive.

I am confident there are financial advisors that can provide the proper behavioral coaching that makes them well worth the cost. At the same time, clearly many are not providing the advertised guidance and discipline. The problem remains – how does Average Joe investor find the good ones? I still know of no clear-cut way.