 This is not a happy post, but it’s also the reality for a lot of people so I think it is a valid discussion. The Early Retirement forums had a thread recently titled What If You Run Out of Money?:
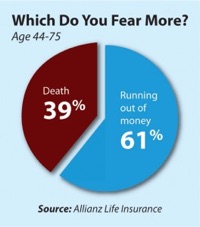
I’m wondering–what would happen to someone who literally ran out of money before they died? I mean, if someone is in their 80s and penniless, would society really let them just die in their home? […] Does anybody actually know anybody who ran out of money after they retired because they didn’t save enough?
As you can see in the pie chart, an Allianz Insurance survey found that 61% of the Baby Boomer generation feared outliving their money more than they feared their own death (source).
My answer is yes, I know someone who essentially ran out of money in retirement. The person was an older, single female coworker who retired right when I started working. While I don’t know her entire life story, she did not have any sort of savings when her job ended. Without a pension, 401k, or individual savings, her sole source of income was Social Security of about $1,000 a month. (Now that I know the terminology, maybe there was SSI.) She was forced to sell most of her things and relocate to a cheap part of Florida (warmer weather, no state income taxes) and move into a mobile home where the rent was under $500 a month. It had a name like “Sunny Gardens”, and while she wasn’t starving or homeless, it was a very precarious lifestyle. Many of her neighbors were in a similar situation.
This Atlantic article This Is What Life Without Retirement Savings Looks Like tells pretty much the same story.
- You will work as long as you are physically able to do so.
- You will rely on Social Security, Supplemental Security Income (SSI), which is a program for low-income seniors, and/or Social Security Disability Income (SSDI).
- You may have to find a roommate to sharing housing costs and utilities. Otherwise, you might move into a mobile home, or simply rent a room in a house.
- You will rely on whatever other local/state governmental assistance is available, for example Section 8 housing vouchers.
- You may have to ask for assistance from family, friends, church-members, and charities.
- You may have trouble paying for your medications when not covered by Medicare or Medicaid.
- It will be difficult to avoid racking up debt and thus making it even harder to get back out of survival mode.
I was going to say “No, society wouldn’t just let them die” but then I read the stat that nearly half of all single homeless adults were aged 50 and older in 2016, as compared to 11 percent in 1990. There is a social safety net as described above, but that net has holes.
In terms of public policy, it remains quite a challenge to design a better social safety net that people think is fair, compassionate, and not open to abuse. I root for the people fighting that fight. Some people have overcome struggles that I can’t even fathom, and I try to avoid making judgments on others without knowing the entire picture. At the same time, I also think it’s important to keep believing that our individual actions matter. All we can do is play our best with the cards we were dealt. (And maybe help others out based on our own abilities.)
 Here’s a refreshingly blunt quote from Scott Galloway’s article
  I was surprised to read the NY Times article
 Like many others, I had a vague goal of $1 million net worth in my 20s. It’s easy to find a theoretical path a million. For example, $750 per month earning 8% returns for 30 years with get you there. Doing the actual earning, saving and investing is the hard part. It gets even harder during a bear market when your money feels like it is burning up in flames.


 Vanguard recently released How America Saves 2018 report [PDF], which looks at the nearly 5 million 401k, 403b, and other defined-contribution retirement plans that they service. If you are curious about how your 401k stats compare with others, there is a great deal of information in this report. Here are a few quick stats based on 2017 data:
 T. Rowe Price has a brochure The Benefit of Saving Regularly For Retirement [pdf] which has the common advice that you target saving at least 15% of your gross income each year to prepare for retirement. Of course, the earlier you start, the better. The added wrinkle here is that they offer an alternative route if you find 15% a stretch when you are young.
 Every time a large corporation stumbles, you will see something along these lines:
  You may have read recently that the Social Security Trust Fund is starting to shrink, and that it is projected to run out of money in 16 years. (Medicare’s trust fund is projected to run out in 8.) This is not the same thing as Social Security itself running out of money, as most Social Security payments to retirees come from the payroll taxes paid by current workers. As the

 If you have researched retirement at all (early or otherwise), you’ve probably ran across various retirement calculators online. You input how much money you have (or plan to have), your asset allocation, and it spits out some numbers. This


 Should a person who retires at age 70 withdraw the same amount of money from their portfolio as someone who is age 40? You’re talking about a retirement period that is likely twice as long as the other. In an article titled
  When it comes to making your portfolio last a lifetime, you may be surprised at how long that might be. According to this Vanguard longevity tool, for a couple both age 40 today, there is a 50% chance that one will live to 88. That’s 48 years.
 The Best Credit Card Bonus Offers – 2026
 Big List of Free Stocks from Brokerage Apps
 Best Interest Rates on Cash - 2026
 Free Credit Scores x 3 + Free Credit Monitoring
 Best No Fee 0% APR Balance Transfer Offers
 Little-Known Cellular Data Plans That Can Save Big Money
 How To Haggle Your Cable or Direct TV Bill
 Big List of Free Consumer Data Reports (Credit, Rent, Work)